Introduction
Dynamic laser scanning systems have become an essential part of the survey and documentation toolbox thanks to benefits such as faster workflows, easy capture of panoramic imagery, photorealistic point clouds, and automated processing.
But there is still one major roadblock to wider adoption: The 3D-capture industry has not established a standardized method for estimating or verifying the accuracy of a dynamic laser scanning system. As such, professionals who require high-accuracy deliverables can find it challenging to trust stated accuracy specifications – making it difficult to know whether a SLAM-based dynamic laser scanning system is appropriate for their current project.
In this document, NavVis will address this problem by demonstrating a rigorous, reliable, and survey-based method for verifying the accuracy of point clouds produced by a dynamic laser scanning system.
We use the NavVis VLX 3 scanner for our benchmarking, but the method is repeatable and could be used to establish the accuracy — and trustworthiness — of any measurement device, including total stations, terrestrial scanners, and SLAM-based dynamic laser scanning systems.
The challenge of estimating and verifying accuracy for a dynamic laser scanning system
For surveyors or other professionals who rely on high-accuracy instruments, it is crucial to estimate and verify the accuracy of the instrument’s real-world measurements.
With a dynamic laser scanning system, this task is challenging. Estimating the accuracy of a device in a specific environment requires significant experience, and verifying the result is much more complex than with other devices.
This section will demonstrate the extent of this challenge.
To do so, we will explain how to estimate and verify the measurement accuracy of three instruments, in order of increasing difficulty: total station, static terrestrial laser scanner (TLS), and dynamic laser scanning system.
1. Total Station
Estimating the accuracy of the total station’s measurements is trivial because we can consult the datasheet to find the accuracy of the hardware components. Using this information, we calculate the expected accuracy of the results.
Verifying the accuracy is equally simple: we measure a point in the environment with the total station, then measure that same point with a reference measurement tool. Now we compare the two measurements to make an accuracy statement for the total station’s results.
2. Terrestrial Laser Scanner (TLS)
Estimating the accuracy of a single point measurement is simple. Again, we can find the accuracy of the components and use those numbers to estimate the accuracy of a single point in the point cloud.
Verifying the accuracy of this point measurement, however, is more complex. The problem is that a TLS does not measure repeatable points. It measures points spread randomly around the scan area. This makes it virtually impossible to locate the same point in both the point cloud and the real world, and then compare them.
We solve this by placing targets in the scan area (for example, checkerboard markers or spheres).
This is more labor intensive, but it enables us to extract the target’s coordinates from the point cloud, measure the point with a reference instrument, and compare the two measurements. Now we can make an accuracy statement about the results of the TLS.
3. Dynamic Laser Scanning System
As with the total station and the TLS, the hardware components affect the accuracy of the final point cloud. However, there are many other factors at play, so in this case, estimating the accuracy of a single point measurement is challenging.
The biggest is the sophisticated algorithms that enable the operator to capture as they walk. Known as simultaneous localization and mapping (SLAM), these algorithms have a significant effect on the accuracy of the final point cloud. And the extent of this effect is unknown unless you have access to the original algorithms themselves.
Estimating the accuracy of a point measurement would require us to perform calculations that account for the effects of the SLAM — a prohibitively challenging task.
Not only is estimating the accuracy of the point measurement difficult, but verifying it is as well. Again, this challenge is due to the SLAM processing.
To explain: SLAM works by tracking the scanner's trajectory through the scan. When the scanning workflow is complete, it passes information to the processing software, which generates a final point cloud.
This software runs the data through further algorithms to produce the best-possible point cloud. During this step the link between the trajectory and the single point is broken.
As a result, we can use the scanner’s trajectory to find its location at any time during the scan. But we cannot find the point measurements that the scanner captured from that location.
This makes it impossible to perform the same verification workflow as we would use for a TLS. If we do not know the scanner's location when a target was captured — also known as the measurement’s origin — we cannot calculate the angular and distance accuracy numbers for that point measurement. And that prevents us from making a final statement about an instrument’s accuracy.
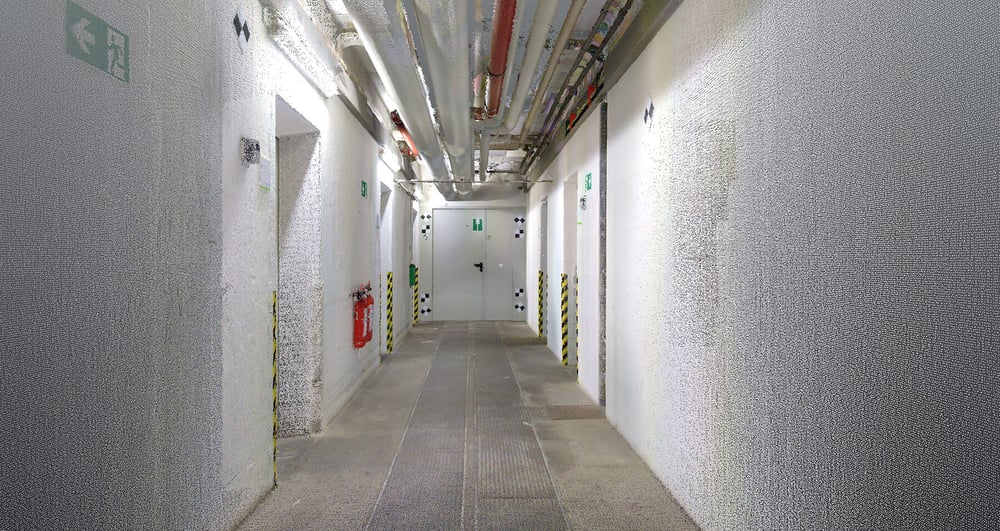
RGB colorized point cloud of testing scenario with checkerboard targets
How to verify the accuracy of a dynamic laser scanning point cloud
This section describes a solution to the challenge of verifying the accuracy of a dynamic laser scanning system. We can approach this solution in two ways.
1. Relative approach (no GCP)
We can use the processing software to finalize the point cloud without ground control points (GCPs), which bypasses the supplemental processing that transforms the point cloud into a higher-grade coordinate system and optimizes the trajectory. The resulting point cloud is unreferenced and the optimization of the trajectory does not use the additional data offered by GCPs.
Here, we place several targets and capture point clouds with the scanner. Then we perform a manual inspection to remove or fix outliers where the target fitting algorithm did not find the correct center of the checkerboard target.
Finally, we measure the point-to-point distance between all possible pairs of targets in the point cloud and compare the results against ground truth distances.
The process is much more labor intensive than verifying the accuracy of results from a total station or TLS. However, it enables us to verify the accuracy of the point cloud without processing it with GCPs.
2. Absolute approach (GCPs)
We can also process the laser scanning system's point clouds using GCPs, which transforms the data into our ground truth coordinate system. Here, the SLAM algorithm can take advantage of the known position of the GCPs to optimize the trajectory of the point cloud.
We can use the data in a number of ways to verify accuracy. For example, we can extract the coordinates for the center of each target in the point cloud and compare them against ground-truth coordinates.
We can also make the same comparison we did with the relative point cloud. To do this, we would extract point-to-point distances between all possible pairs of targets and compare the results against ground truth.
Either method enables us to verify the accuracy of the point cloud after it has been processed with GCPs.
But the second option has a crucial benefit: Each point-to-point distance measurement we extract from the referenced point cloud has a corresponding point-to-point distance measurement in the unreferenced point cloud. That means we can make a 1:1 comparison of the two sets of results, to establish the effect of GCP processing on point cloud accuracy.
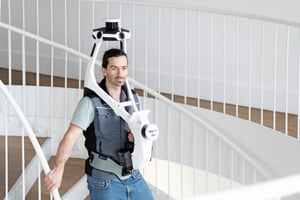
Details of our workflows for evaluating NavVis VLX 3 accuracy
The following chapter describes the two approaches NavVis used to determine the accuracy of a point cloud collected with a NavVis VLX 3 dynamic laser scanner.
Both approaches use a reference system as ground truth which was measured with a high accuracy industrial laser tracker system. For more information on the laser tracker see section Reference system acquisition with laser tracker.
1. Relative approach no GCPs)
We distributed 43 checkerboard targets around the site randomly. Then we contracted with an external service provider to obtain high-accuracy measurements for the target centers with a laser tracker. From there, we calculated the point-to-point distances between every possible target pair and produced a ground-truth data set with 903 distances.
Next, we captured the site with a NavVis VLX 3 system and processed the data without using ground control, leaving the point cloud unreferenced and in its relative coordinate system. Then we calculated the point-to-point distances between all possible pairs of targets in the point cloud.
We repeated this process with 11 other NavVis VLX 3 systems to generate a total of 12 point clouds and 12 sets of point-to-point measurements.
To finish, we compared each point-to-point measurement from the 12 point clouds against the ground truth. This yielded deviation data, which enabled us to make an accuracy statement for the unreferenced (relative) point cloud.
Though we use this approach for a NavVis VLX 3, it can be used to benchmark any total station, terrestrial laser scanning system, or dynamic laser scanning system.
2. Absolute approach (GCPs)
We used the same ground truth data and NavVis VLX 3 raw data we produced for the relative accuracy approach. However, we processed the point clouds using GCPs measured by laser tracker, and therefore in the same coordinate system as the targets.
This enabled us to extract the coordinates of each checkerboard target from the point clouds and compare them against the reference coordinates for that target. Now we knew how far each target in the point cloud deviated from the ground truth — in all three dimensions.
This deviation data also made the detection of possible outliers much simpler.
Then, we compared the accuracy of point-to-point distances, which enabled us to make an accuracy statement for the referenced (absolute) point cloud.
3. Determining the influence of control points
As you can see above: While verifying the accuracy of NavVis VLX 3 results, we processed the same point clouds with and without GCPs. That means we can compare the two sets of results, to quantify the positive effects of GCP processing with precision.
Testing details
This section describes the test site and workflow details, such as the placement of targets, scanning time, and how we extracted measurements.
1. Test site
We chose the basement of our offices in Munich since this environment represents a common scanning scenario for a dynamic laser scanning. It was also an ideal testing laboratory, since we could control variables for repeatable results.
- Walls are solid and stationary
- Ambient temperature is stable
- The site is frequently accessible, and without any special permission
- Other traffic is minimal
- Targets are unlikely to be vandalized or worn off
To further control variables and reduce complexity, we captured only a portion of the basement rather than the full scenario.
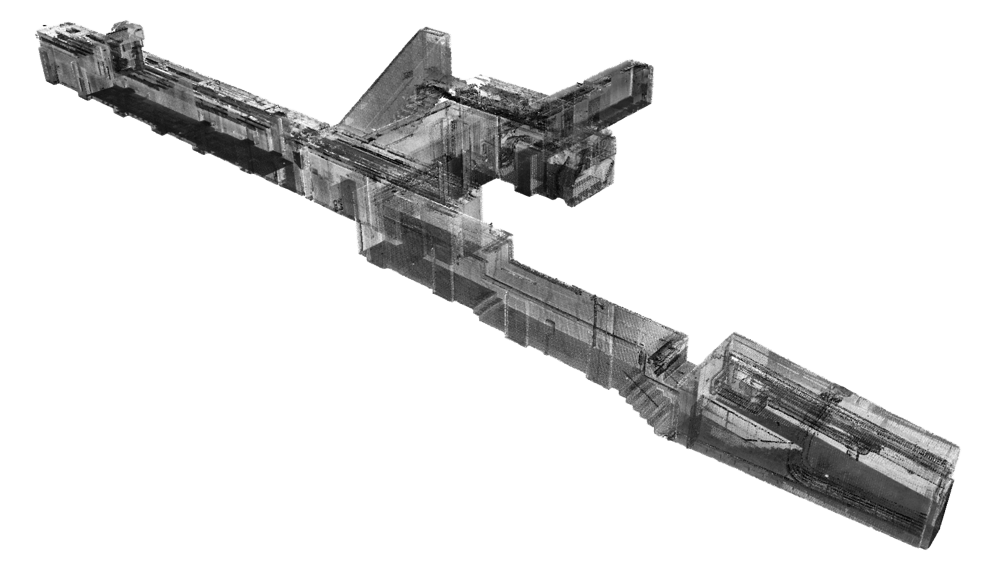
Figure 1: 3D-view of basement point cloud
The site’s dimensions are ~52 meters by ~22 meters, with no direct line of sight from one end to the other. The mapped area is about 180 square meters. Corridors have an average height of 2.20 meters and a width of 2 meters. The corridors are at slightly different heights, and each connects to stairs.
2. Target placement and distribution
To create reference markers that we could capture with the laser-tracker and repeatedly with NavVis VLX 3 instruments, we used standard 15 cm x 15 cm checkerboard targets with wide wavelength compatibility.
We placed 43 targets randomly throughout the environment. As a precaution against movement, we used a 3 mm aluminum DIBOND plate to glue each target to the wall.

Figure 2: sticky targets from a common laser scanning equipment provider

Figure 3: target on DIBOND® plate mounted on the wall
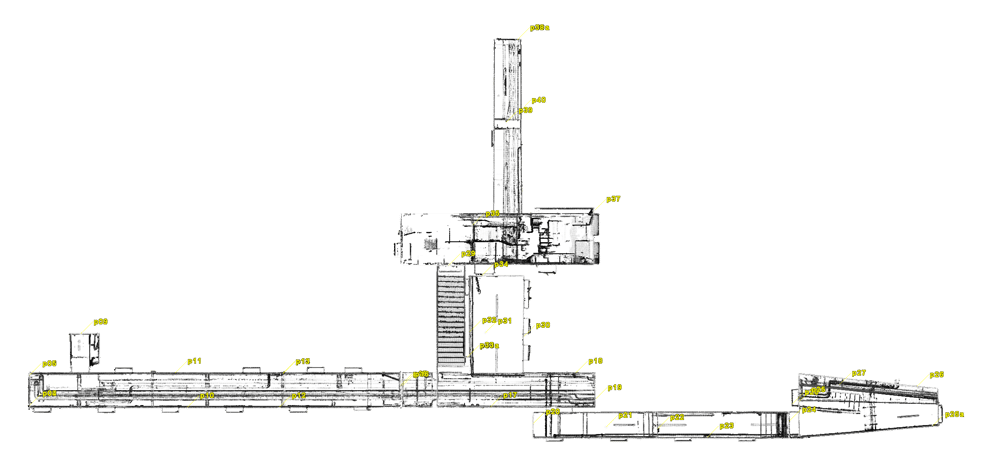
Figure 4: location of checkerboard targets for accuracy estimation
3. Scanning
It takes one operator approximately 12 minutes to scan the scenario with NavVis VLX 3, including the capture of panoramic images and ground-control points.
This capture process was fast enough that NavVis was able to deploy four different operators for the 12 scans. This enabled us to test the accuracy of the system for different operators.
4. Target and line extraction
We extracted the center points from the targets using Cyclone software from Leica Geosystems. When a technician picks a point close to the center of the target, the software uses a reliable, industry-standard algorithm to calculate the true center and provide coordinates.

Figure 5: RGB colored B&W target |

Figure 6: intensity multiHue colored B&W target |

Figure 7: intensity grayscale colored B&W target |
When we connect the 43 targets in all possible pairings, we can extract 903 point-to-point lines.
For any given point cloud, about three to four targets could not be extracted properly with the semi-automatic extraction method. Therefore, the total amount of lines per point cloud varies slightly. The calculated distances between the extracted targets range from 10 cm to 50 m.
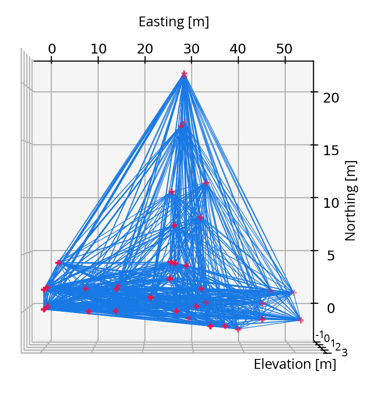
Figure 8: top view - lines
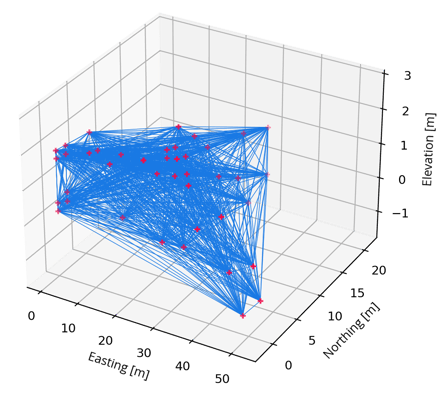
Figure 9: 3D view - lines
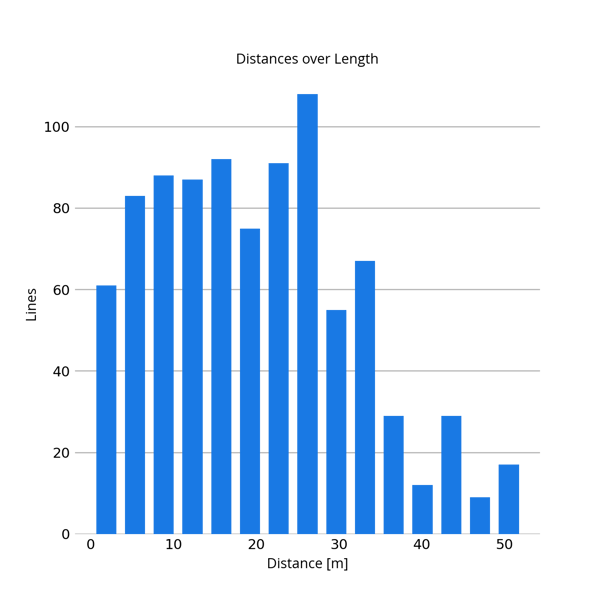
Figure 10: amount of lines per distance
Reference system acquisition with laser tracker
To establish a reference system for use as ground truth, NavVis contracted RAITEC Automation GmbH. The company specializes in various measurement applications, including industrial 3D measurement and 3D scanning.
RAITEC measured the exact center of all 43 checkerboard markers using the API Tracking System Radian Plus 50 and a vProbe.
This measurement system is designed for industrial applications that require sub-millimeter accuracy. According to the laser tracker’s report, the data exhibits an average deviation of only 0.08 mm across all setups.
We chose this tool because the verification process requires a testing instrument that is 3 times more accurate than the scanner itself. This means that 99.7% (3σ) of the reference measurements gathered by the laser tracker should be more accurate than the NavVis VLX 3’s 5 mm accuracy at 1σ.
Since RAITEC’s measurements exceeded our requirements, we were able to treat this reference data as error-free ground truth.
Figure 11: API tracking system radian plus 50
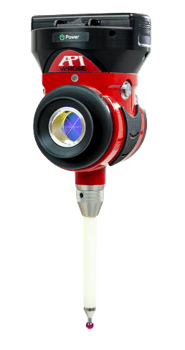
Figure 12: vProbe for API tracking system
Checking for outliers
We extracted a sum of 9229 distances from the 12 unreferenced point clouds and 9460 distances from the 12 referenced point clouds. Despite this large number of measurements, we determined that it was crucial to review the data for potential outliers – distances that differed significantly from the other results – and correct them where possible.
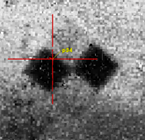
Figure 13: target extraction failed for P34
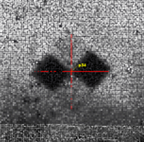
Figure 14: re-fitted target P34
1. Relative approach (no GCPs)
To find outliers in the relative point cloud, we examined the distance measurements manually
We quickly found that the point cloud produced by one instrument showed larger than expected values for any distance involving the target P34.
A closer look revealed that the center of the target as extracted from the point cloud did not match the real center of the target. After a re-fit, we extracted the center again. Now, the newly calculated distances no longer appeared as outliers.
When the examination focused on deviations greater than 15 mm, we identified three further outliers. Since there was no obvious misfit, we retained the extracted targets for calculation without removing or refitting.
2. Absolute approach (GCPs)
As previously mentioned, this approach involved processing the data with ground control points, which generated a point cloud in the coordinate system of the reference data.
Despite this processing, outlier distances can still occur in the final point cloud. Fortunately, referencing the data enables us to identify the outliers with less work. We can compare the point cloud against the reference data and find where the target coordinates deviate in 3D, indicating the possibility of an incorrectly extracted target.
The following chart shows the extracted targets and their corresponding 3D deviation from the reference coordinate.
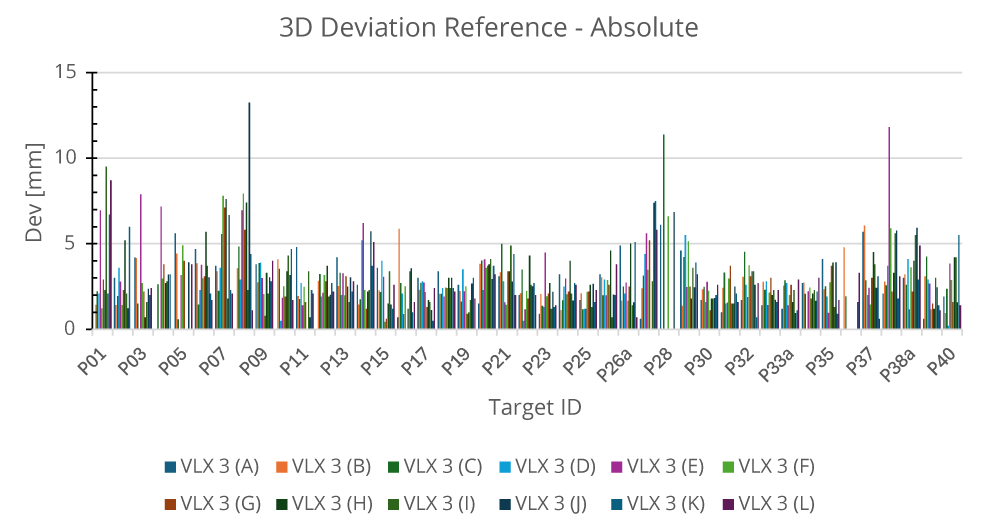
Figure 15: 3D-deviation per NavVis VLX 3
The graph has three peaks, corresponding to targets P08, P28, and P38.
Examining the P08 target more closely, we found an obvious misplacement of the center in the rgb colorized point cloud. Due to insufficient intensity contrast, the algorithm was not able to find a proper target center. See Figure 16: Target P08.
Target P28 was placed in a location where the scanners had a line of sight to the target for only a short time. Therefore, the point density and intensity in that area made target identification challenging. See Figure 17: Target P28.
Target P38 has a slightly asymmetric intensity distribution in the point cloud. A visual inspection verifies that the target’s center was incorrect. See Figure 18: Target P38.
 
Figure 16: target P08 |

Figure 17: target P28 |

Figure 18: target P38 |
When it became clear that these three outliers were incorrect measurements, we removed them from further calculations. Though some extracted targets did not show ideal intensity information, from a visual point of view they are still correct, so we kept them for further investigation.
Results for relative approach (no GCPs)
The following histogram shows how far each measured point-to-point distance deviates from ground truth. Error distribution is organized in 0.5 mm “buckets.” The yellow indicates the percentile line.
To illustrate how to read the results: The red lines show that at 68% the error is 3.1 mm, which means that 68% of the point cloud distance measurements deviate from ground truth by 3.1 mm or less.
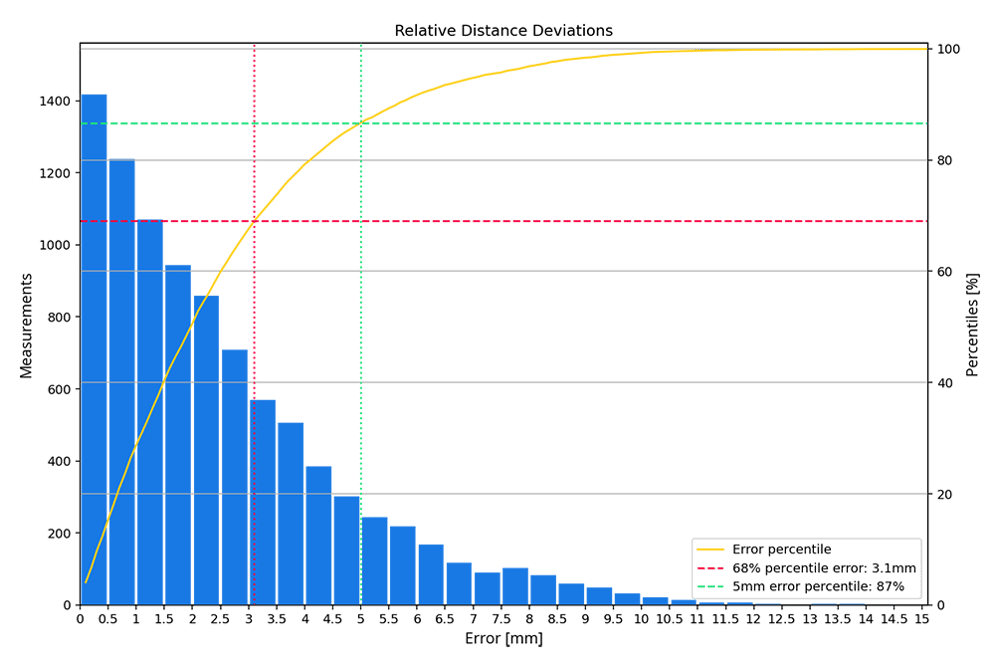 Figure 19: relative deviation histogram
The green lines indicate the 5 mm accuracy as stated in the NavVis VLX 3 specification sheet. Looking at the line shows that 87% of the distance measurements extracted from the point cloud deviate from ground truth by 5 mm or less.
Results for absolute approach (GCPs)
As previously stated, for the absolute approach we processed all point cloud data using NavVis VLX 3 ground control point functionality. It’s important to note that we did not consider the accuracy and precision with which the operators manually tapped the GCPs.
As mentioned in the chapter How to verify the accuracy of a dynamic laser scanning point cloud, the absolute approach could be used to benchmark accuracy in a number of different ways.
1. Point to point comparison: absolute points vs. reference points
The graph below illustrates how far the target centers in the point clouds deviate from ground truth. All outliers have been removed.
For the 478 observations (each corresponding to a single point), the average deviation is 2.8 mm and the median is 2.5 mm. 
Figure 20: 3D-deviation per NavVis VLX 3 - outliers reduced NavVis VLX 3
2. Distance comparison absolute data vs. reference data
The following histogram shows how far the point-to-point distance measurements in the point clouds deviate from ground truth.
The error distribution is in 0.5 mm “buckets.” The yellow line indicates the percentile line. To illustrate how to read the results: At 68% (as mentioned before) the error is 2.1 mm. This means that 68% of the distance measurements in the point clouds deviate from ground truth by 2.1 mm or less.
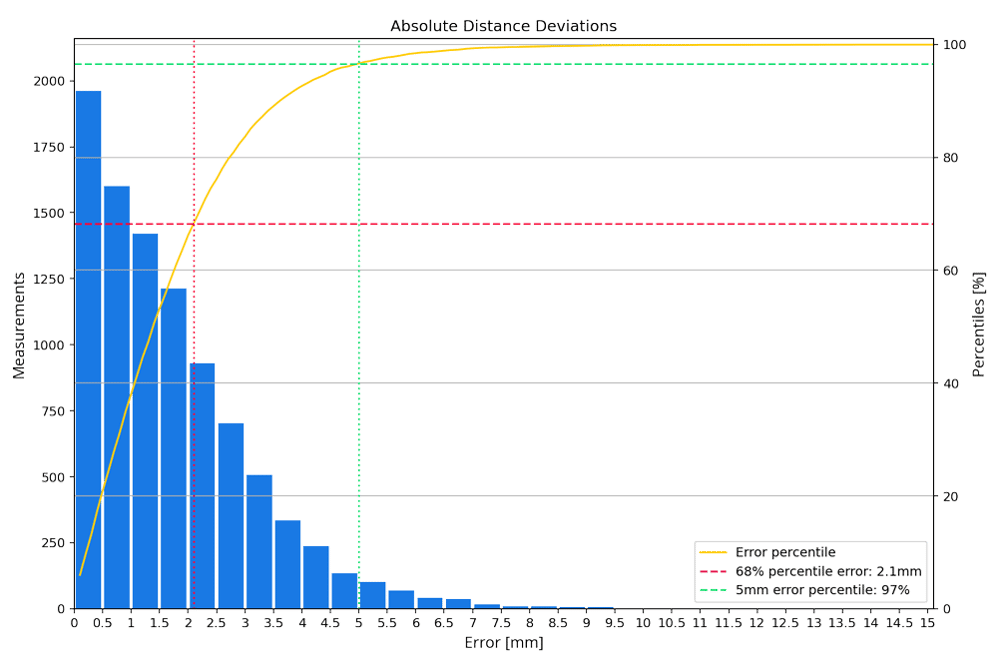
Figure 21: absolute deviation histogram
The green line indicates the 5 mm accuracy number as stated in the NavVis VLX 3 specification sheet. Looking at the line shows that 97% of the distance measurements extracted from the point clouds deviate from ground truth by 5 mm or less.
Summary
As tested, all 12 NavVis VLX 3 instruments performed better than stated in the specification sheet.
Even without the usage of GCPs, the accuracy can be stated to be 3.2 mm at 68% ~1 σ for that specific scenario. The following table shows the summarized results of the distance measurements described in that document.


