What NavVis technology can do for your green building certification
Introduction: LEED & Credit
What is LEED?
Understanding LEED
LEED (Leadership in Energy and Environmental Design) is a globally recognized green building rating system that promotes healthy, efficient, and cost-effective green buildings. It helps project teams achieve sustainability goals by offering a framework based on environmental principles. LEED certification indicates a significant achievement in sustainability and leadership, guiding project teams towards environmentally friendly options aligned with their objectives.
Exploring green building
The green building certification focuses on the positive impacts of the built environment on nature and occupants. It integrates sustainability pillars (people, planet, prosperity) into projects by considering factors like energy usage, water consumption, indoor air quality, and material choices. LEED serves as a tool to promote best practices and innovation in green building design and construction.
Evolution of LEED: How and why
LEED has evolved to adapt to new markets, building types, and environmental insights. Continuous improvement cycles led by the internationally renowned US Green Building Council community help address emerging challenges and opportunities effectively.
Credit sustainable sites:
site assessment v 4.1
In the following discussion, we will delve into the use of NavVis as a solution within the framework of the Sustainable Sites (SS) credit for site assessment. To begin, let's clarify the concept of sustainable site assessment in the context of version 4.1 of the LEED rating system guidelines ("LEED BD+C: New Construction v4.1 - LEED v4.1").
Intent
The purpose is to evaluate site conditions, environmental justice concerns, and cultural and social factors before initiating the design process. This evaluation aims to assess sustainable options and provide insights to guide decisions related to site design.
Requirements
The task involves conducting and documenting a comprehensive site survey or assessment covering the following aspects:
- Vegetation
- Climate
- Topography
- Hydrology
- Soils
- Human Use
The survey or assessment should establish connections between the site's features and the topics mentioned above, illustrating how these features influenced the project design. Explanations should be provided for omitting any of the listed topics.
This framework is adapted from the Sustainable Sites Initiative's "Guidelines and Performance Benchmarks 2009", specifically Prerequisite 2.1: Site Assessment.
A game-changer with NavVis
NavVis's solution and the Credit SS site assessment
What is NavVis?
NavVis focuses on SLAM-based dynamic scanning solutions and a reality capture platform designed to elevate the skills of AEC professionals. By integrating the NavVis LX-Series and NavVis IVION, a holistic reality capture solution is achieved. This innovative technology empowers professionals to conduct virtual site assessments, leading to a substantial boost in productivity per engineering hour and reducing the necessity for on-site visits, such as for evaluating brownfield projects before starting the design process.
What can NavVis do to help with the Credit?
NavVis technology offers several options. One option is to download a point cloud of the scanned environments for use in third-party applications already in place, enabling thorough evaluations and simulations—such as topography contour analyses or shading simulations. Another possibility is to virtually inspect the scanned site using 360-degree panoramic images along with the point cloud in NavVis IVION, for example, measuring vegetation, mapping trees, and identifying paved areas.
Real-life example: Major renovation at NavVis HQ
Prepare for the assessment: Virtual area mapping of the site
In this example, we are planning a major renovation of NavVis HQ in Munich. Before planning begins, a site assessment should be conducted to provide insights that guide decisions related to site design. The assessment is performed in the open space belonging to the HQ—the inner courtyard of the building.
First, the entire building and site are scanned using NavVis VLX, producing a 3D point cloud of the existing structure and 360-degree panoramic images as the output. This output is then accessed via any web browser in NavVis IVION.
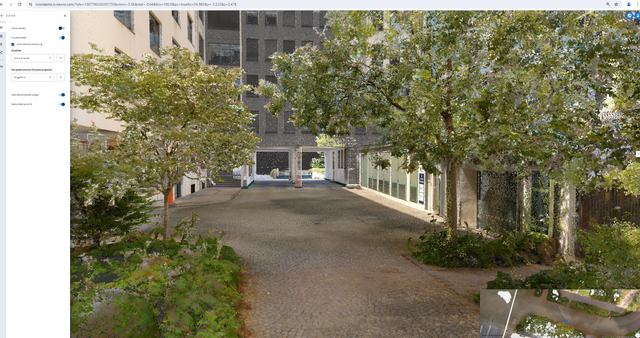
NavVis IVION point cloud view
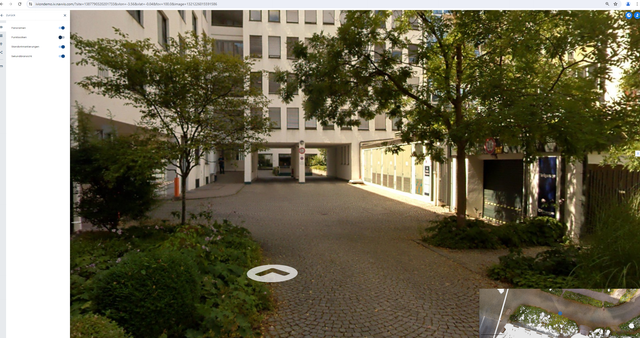
NavVis IVION panoramic view
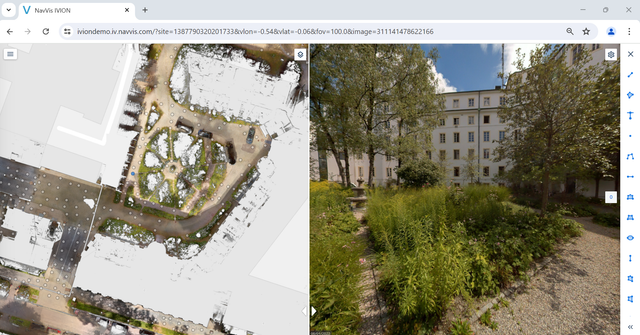
NavVis IVION top-down & panoramic views
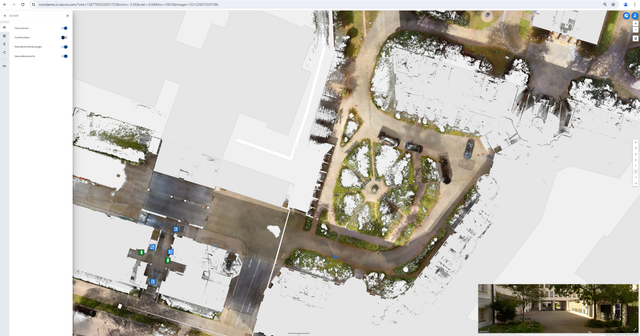
Floor plan / site map view in NavVis IVION
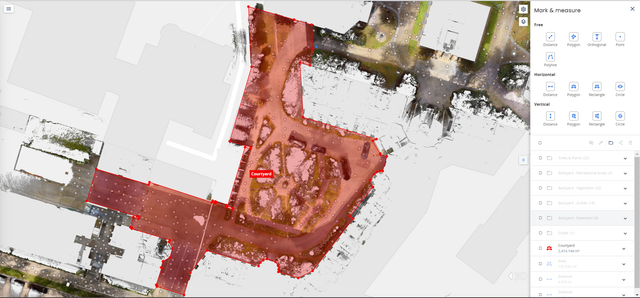
The project boundary, highlighted in NavVis IVION
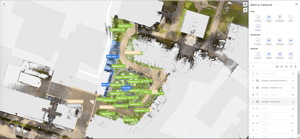
As a second step, to prepare for the assessment, the entire inner courtyard area is virtually mapped using the Mark & Measure tool in NavVis IVION. In this process, the various surface areas are measured according to the LEED requirements and standards described above. The different area types can be sorted within the file structure in NavVis IVION, highlighted in different colors, and named accordingly to simplify site understanding. Area mapping is performed by analyzing the site conditions and area types using 360-degree panoramic images and measurements, while utilizing the geometric and color information from the point cloud.
Overview
In the following screenshots, the mapping outcomes are displayed. They show floor plan views of the point cloud, with different areas (paved areas, vegetation, recreational areas, etc.) mapped in various colors. The file structure is visible on the right side of the user interface, helping categorize the mapped areas by their respective types. This categorization will later be used for assessments such as paved area versus vegetation, identifying area types, or evaluating water runoff potential.
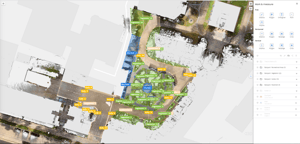
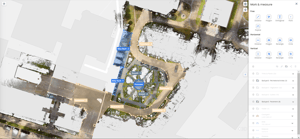
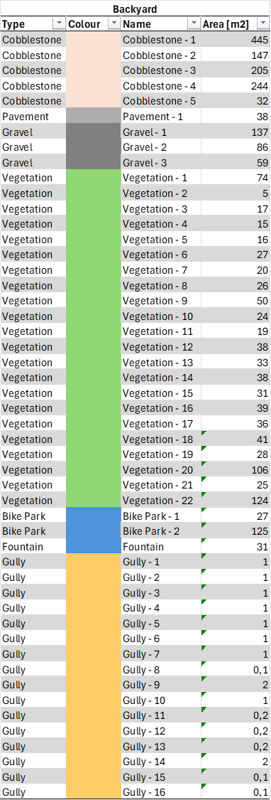
After completing the mapping process in NavVis IVION, the surface area of each type is transferred from NavVis IVION to Microsoft Excel.
In this example from a total site area:
- 2390 m2 for the courtyard
- 1558 m2 is sealed
- 832 m2 is dedicated to vegetation
Out of the total sealed area:
- 1073 m2 is cobblestone
- 282 m2 is gravel
- 183 m2 is recreational
- 38 m2 is paved
- the remaining 13 m2 is occupied with gullies
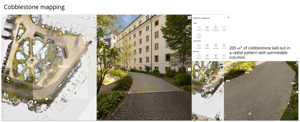
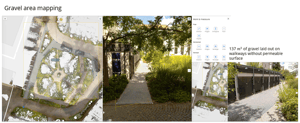
Example flooring: Pavement types
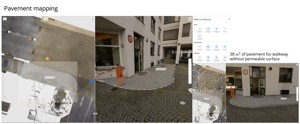
The following example outlines a workflow for identifying and documenting various pavement structures remotely. To determine the type of flooring present on-site, 360-degree panoramic images can be used. For mapping purposes, the point cloud view can be employed to measure the area occupied by each distinct flooring type.
Site assessment: Vegetation
Utilize NavVis IVION to:
- Identify the primary vegetation types by analyzing the 360-degree panoramic images
- Assess greenfield areas and accurately map the extent of vegetated spaces
- Map trees by determining their quantity and measuring their crown diameter
Vegetated area
Vegetation types
Tree mapping
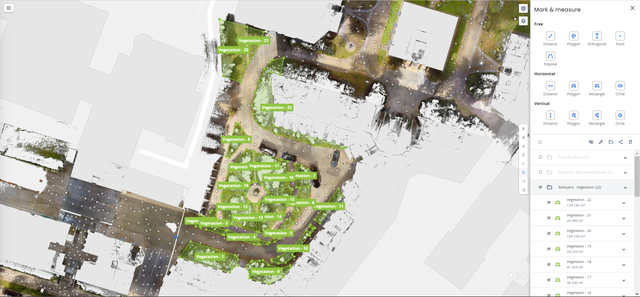
To map the vegetated areas during the site assessment, utilize 360-degree panoramic images to identify them in NavVis IVION. Subsequently, use the Mark and Measure tool to map out all vegetated spaces on the site. This method provides comprehensive coverage, facilitating later analysis for purposes such as open space or heat island criteria. In this example, 35% of the total area is vegetated.
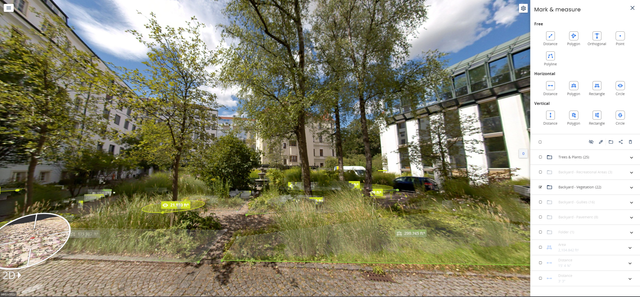
Here, we aim to demonstrate how our engineers successfully identified the primary vegetation types within the inner courtyard without physically visiting the site. Leveraging 360-degree panoramic images in NavVis IVION proved to be an effective method for pinpointing specific vegetation and plant types. While this task may seem straightforward for environmental experts, beginners can benefit from a simple tip: capture a screenshot and use your preferred plant identification database to assist in identifying the right species.


Here, examples of the vegetation types present in the inner courtyard of NavVis HQ are shown. Hereby the location as well as the type of vegetation are documented for the credit using NavVis IVION.

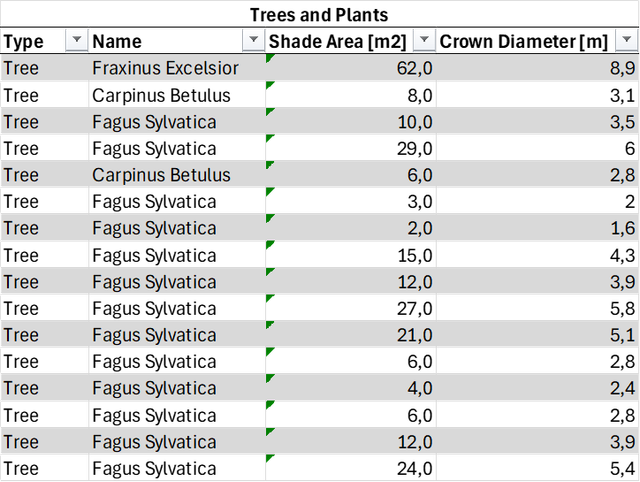
Use NavVis IVION to map notable trees, measure their crown diameters, and assess the corresponding shade areas. Refer to the example screenshots for visual guidance:
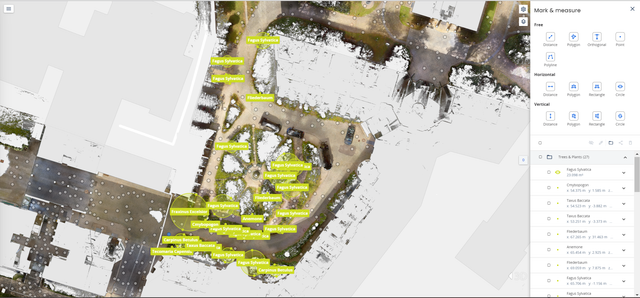
Additionally, the following shows an example list of trees from the site, with their potential shade areas and crown diameters identified using NavVis IVION.
Site assessment: Climate
Utilize NavVis IVION to:
- Assess solar exposure and identify shading opportunities
- Integrate pavement and vegetation mapping with SRI values to pre-evaluate the heat island effect
Shading opportunities
Heat island effect
The shading opportunities provided by trees on the site have been outlined in the "Tree mapping" section above. The total shaded area should be calculated from the trees already mapped, and a percentage can be derived based on the total site area. Other structural elements that provide shade can be identified and measured using NavVis IVION.
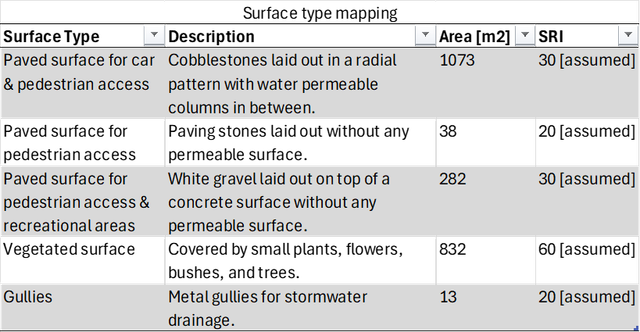
The following table details various surface types, along with their descriptions and respective areas, identified using NavVis IVION. The surfaces were mapped during the general site scanning. Based on the surface criteria documented with the help of NavVis IVION, an estimated SRI value, determined through literature research, is provided.
From these insights, the heat island effect potential can further be calculated.
Site assessment: Hyrdology
Utilize NavVis IVION for a comprehensive visual site assessment to:
- Accurately map natural water bodies, such as wetlands, lakes, streams, and shorelines, along with their respective areas within the site boundary. Use features like Mark & Measure for area calculations, and Points Of Interest (POIs) for concise information summaries
- Evaluate rainwater collection and reuse prospects, and identify opportunities for rainwater harvesting
- Simplify the identification and documentation of different pavement types and areas within the project boundary when analyzing impervious and pervious surfaces
At the example site, no natural water bodies are present.
Impervious and pervious surfaces
Rainwater collection
In the table below, we list the various surface types identified in NavVis IVION, along with their descriptions and respective areas. The identification process is outlined in the preceding paragraphs. Based on the surface criteria, an estimated water permeability value is provided, determined through literature research.
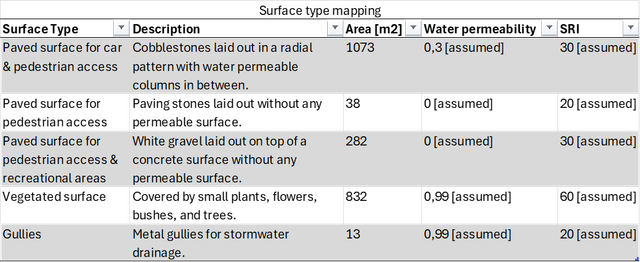
As for the gravel surface, under normal circumstances, it would typically exhibit some level of water permeability. However, in this specific case, a visual inspection in NavVis IVION revealed the presence of an impermeable concrete layer beneath the white gravel. Consequently, the water permeability was considered to be 0 in this scenario.
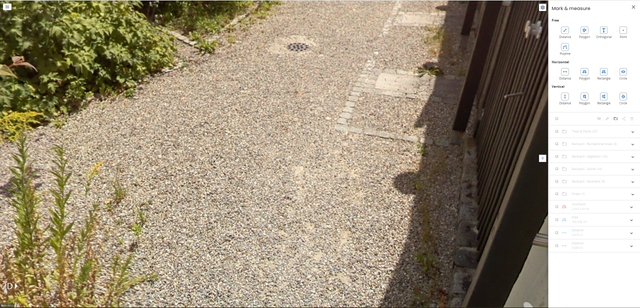
At the example site, 16 gullies were identified, with a total surface area of approximately 13 m². These gullies are used for rainwater runoff, as shown in the example documentation picture above. Areas for rainwater collection and reuse could not be identified.
Site assessment: Topography
Utilize NavVis IVION to:
- Create contour maps, export the point cloud data, and perform contour analysis using third-party software
- Identify distinctive topographic characteristics and generate Points Of Interest (POIs) for these features
Contour analysis
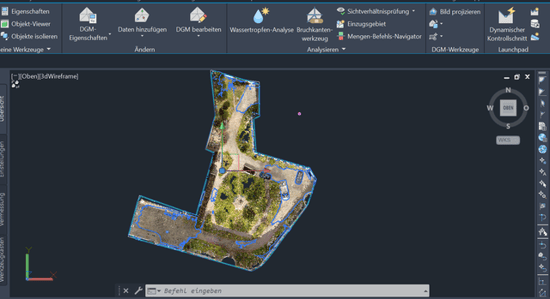
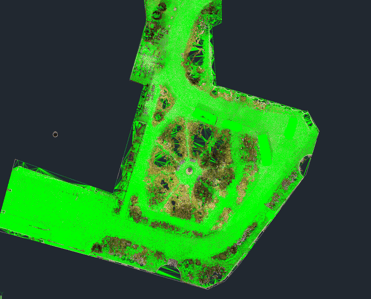
First, use Crop & Download in NavVis IVION to download the required section of the point cloud:
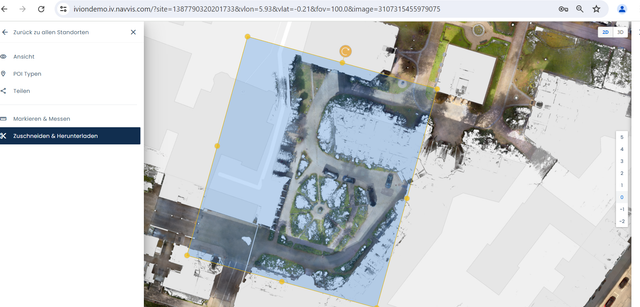
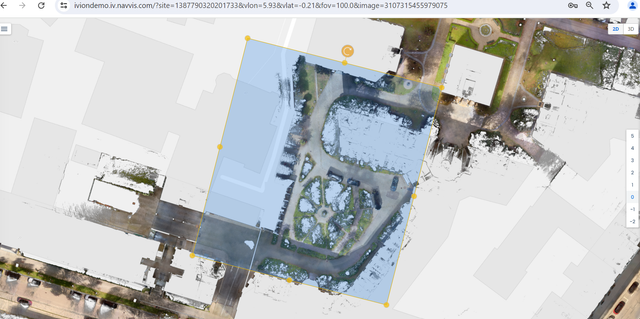
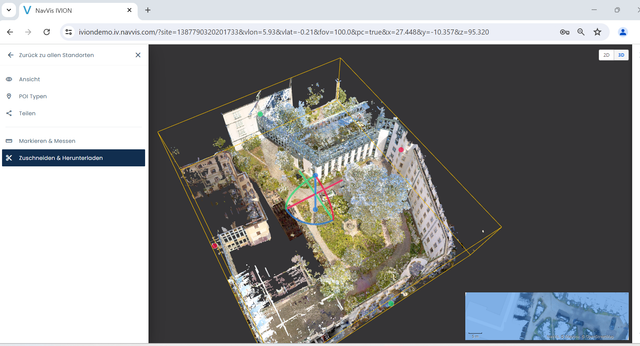
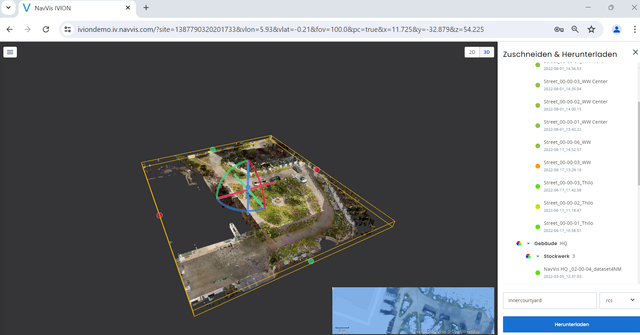
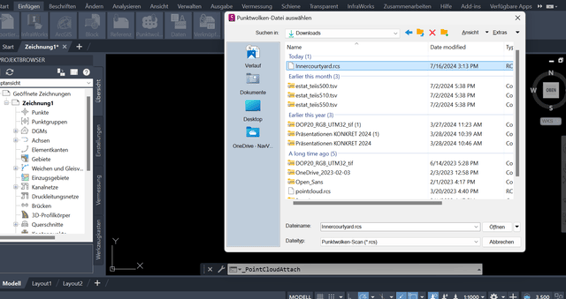
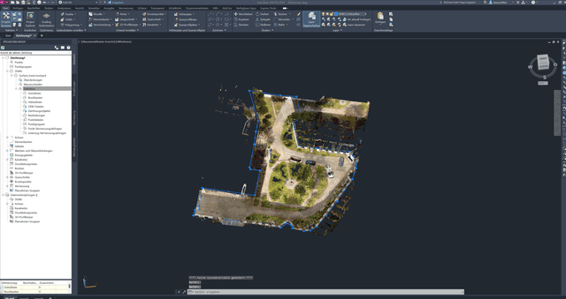
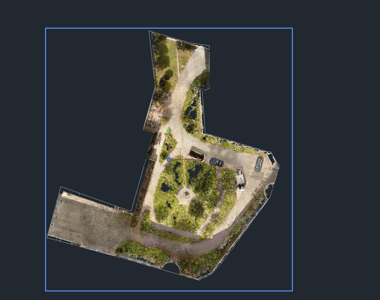
You can then clean the point cloud and analyze the contours using third-party software. The area can be edited based on the capabilities of the software you choose, for example, by excluding cars or areas outside the project boundary. The surface slope and contours can be derived from the final result.
Here is an example in Autodesk Civil 3D:
Site assessment: Human use & health
Utilize NavVis IVION to:
- Identify bicycle storage areas using map views
- Showcase various uses within the site boundary through 360-degree panoramic images
- Create an inventory of construction materials for recycling, thanks to the Mark & Measure feature
- Investigate physical activity opportunities, establish an inventory of Points Of Interest (POIs), and measure activity areas
With NavVis IVION, it was determined that 7% of the total area is designed for human and recreational use. There are two bike parks, one open and one enclosed, as well as a circular area in the middle of the courtyard for recreational purposes.

Human use
Human health effects
Use NavVis IVION to map the bicycle network and bicycle storage areas. Different views of the courtyard were also captured using the panoramic view.
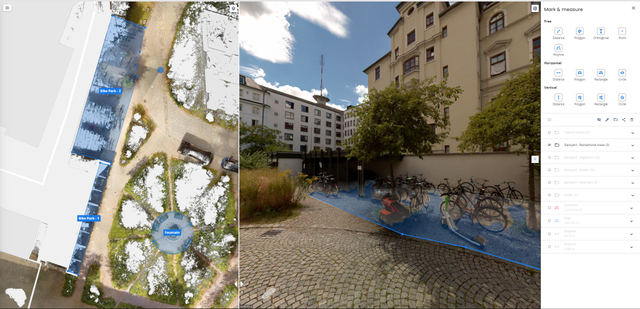
Adjacent transportation infrastructure, diverse uses of the site, and construction materials with recycling or reuse potential can also be identified using NavVis IVION.
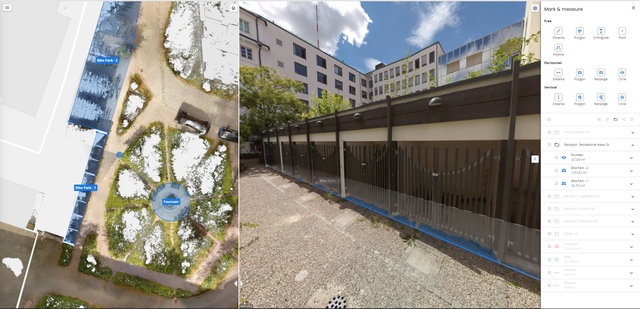
A fountain with surrounding benches for sitting and relaxing during breaks was mapped using NavVis IVION. If available, other opportunities for activities that positively impact human health can also be identified and listed in NavVis IVION.

Conclusion
While conducting a site assessment solely through virtual means may not be entirely practical, a significant portion can be effectively completed with the assistance of NavVis technology. Its dynamic scanning capabilities provide accurate site data at scale, and the ease of use of its reality access solution further enhances efficiency.
NavVis should be used to complement, not always replace, a physical site visit, which is still necessary for tasks like soil sampling, and to supplement information such as:
- Average monthly precipitation and temperature ranges
- Lists of federally or state-threatened or endangered species; for projects outside the U.S., the International Union for Conservation of Nature (IUCN) Red List of Threatened Species
- When these specialized needs are fulfilled differently, NavVis technology can significantly reduce the number and duration of visits, as well as the number of visitors—many professional roles no longer require physical inspections.
In summary, using NavVis technology greatly improves the efficiency of obtaining credits and conducting sustainable site assessments according to LEED standards. It reduces the need for on-site travel and expedites area mapping and documentation processes.
.jpg?width=300&name=sustainability-page-concept-environmentally-friendly-production-pond-shaped-like-factory-middle-lush-forest-3d-rendering%20(1).jpg)